


Frequently Asked Questions
What goes into the true cost of a single visit?
Chemicals used per visit, time on site (paid at your tech’s hourly rate), drive time (paid time), fuel and vehicle wear per stop, plus a share of overhead (truck payments, insurance, software, phones). Add those to get the visit cost and compare to the customer’s rate.
How do I calculate whether an account is profitable?
For each account list monthly rate, visits/month, chemical cost/visit, minutes on site, drive minutes, fuel/visit, and hourly pay. Add overhead share (monthly overhead ÷ active accounts). Total costs vs. rate = monthly profit. Divide profit by rate to get margin. Mark accounts below your target margin.
When should I raise rates and how should I tell customers?
Decide rates in winter—before season starts. Small, clear increases announced weeks before opening are easier for customers to accept than big, last-minute hikes. Reprice thin accounts first; explain the reason (rising chemical, fuel, or labor costs) and offer a modest, timed change.
What records do I need to run these numbers?
Use job and invoice records for rates and visits (Skimmer provides this), supplier invoices for chemical costs, payroll reports for labor, fuel receipts, bank statements, and a monthly overhead total (trucks, insurance, software, phones, rent). A spreadsheet is fine to tie these to each account.
Why won’t my accounting software show per-account profits?
Most accounting tools aggregate revenue and expenses into company-level categories and don’t link costs to individual jobs, routes, or accounts. That’s why P&Ls miss per-account drivers. Use job-level records (or Skimmer Bookkeeping) or a spreadsheet to map costs to accounts for accurate per-customer profitability.
Key takeaways
- Costs move—chemicals, fuel, tech pay—but rates often don't. Do account-level math in winter so small margins don’t quietly turn into losses.
- True cost per visit = chemicals + on-site labor (paid time) + drive time + fuel/vehicle wear + a share of overhead. Compare that total to the rate to see what each account actually earns.
- You don’t need fancy tools: a spreadsheet works. List accounts, plug in rate, visits, chemical cost/visit, minutes on site and drive, hourly pay, fuel, and overhead share using invoices and payroll for accuracy.
- Use the results to act—keep profitable accounts, modestly raise thin ones in winter, reprice/reroute or drop money-losing stops—and keep your bookkeeping current (Skimmer helps make those numbers reliable).
##Key takeaways##
Chemical prices move. Fuel moves. Tech pay moves. Your rates often don't, or at least not as often.
That's not a mistake. Raising rates is uncomfortable, and when the season is busy, it's easy to put off. But every year the gap goes unchecked, a few accounts quietly slide from profitable to break-even, or worse.
Winter is when most pool pros decide what next season will cost. Before you make that call, it helps to know what each account is actually earning you.
What one visit really costs
When you look at an account, it's natural to think about the monthly rate. But the rate is only half the picture. Here's what goes into each visit:
- Chemicals: what you use per visit, on average.
- Time on site: how long the job takes, at what you pay your tech per hour (or what your own hour is worth, if it's you).
- Drive time: the minutes between this stop and the last one. Drive time is paid time, even though it doesn't feel like work.
- Fuel and vehicle wear: a few dollars per stop, depending on your route.
- A share of overhead: truck payments, insurance, software, and phones don't belong to any one account, but every account has to help cover them.
Add those up, and you get the true cost of an account. Compare it to the rate, and you get what the account earns you.
An example
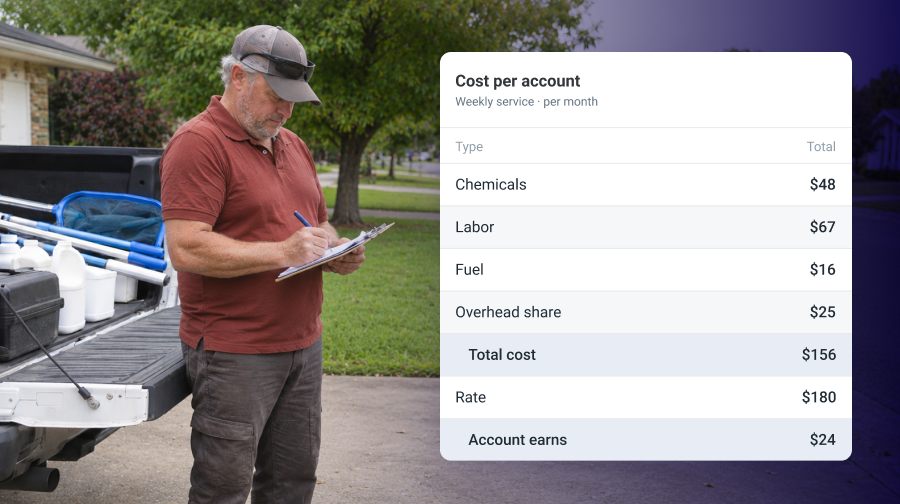
Here's a made-up account to show the math. These aren't benchmarks, just round numbers.
Say you charge $180 a month for weekly service, so four visits. Each visit uses about $12 in chemicals. The job takes 25 minutes on site and 15 minutes of driving, and you pay $25 an hour. Fuel runs about $4 a stop. Your overhead is $2,000 a month, spread across 80 accounts.
Twenty-four dollars a month isn't nothing, but it's thin. If chemical costs rise by a few dollars a visit, or that stop picks up another 10 minutes of drive time, this account is close to break-even.
Now imagine running that math on every account. Some will be comfortably profitable. Some won't. That's the list you need before you set next season's rates.
Run the numbers on your own accounts
You don't need special software for this. A spreadsheet, or even a notepad, works fine.
- List your accounts. Start with the ones you suspect are thin, like long drives, big pools, or old rates.
- Fill in the basics for each one: monthly rate, visits per month, chemical cost per visit, minutes on site, drive minutes, fuel per visit, and what you pay per hour.
- Work out your overhead share. Add up a month of overhead (trucks, insurance, software, phones, rent), then divide by your number of active accounts.
- Add up the cost of each account. Chemicals, labor (time on site plus drive time, at your hourly rate), fuel, and the overhead share.
- Subtract it from the rate. That's what the account earns you each month. Divide by the rate to get a margin.
- Pick your own target margin and mark every account that falls below it. That's your repricing list.
Your Skimmer job and invoice records give you rates and visits. Supplier invoices, payroll reports, and bank statements give you the costs.
What to do with the answer
Once you know what each account earns, the decisions get clearer:
- Accounts that earn well: keep them, and keep them happy.
- Accounts that are thin: consider a modest increase for next season. A small change, explained clearly, is usually easier for customers to accept than a big one later.
- Accounts that lose money: look at why. Sometimes it's the rate. Sometimes it's a long drive, a pool that takes twice as long, or a customer who needs extra visits. Reprice, reroute, or decide whether the account is worth keeping.
Timing matters too. Telling customers about a rate change in winter, with a few weeks' notice, is a lot easier than springing it on them at opening.
Why your tools don't show you this
If this took longer than it should have, that's not on you. Most accounting software sees revenue and expenses. It doesn't see jobs, routes, or accounts. So you can see your total chemical spend for the year, but not which accounts are driving it.
It's even harder if your books live in a separate system from your jobs and invoices, sorted into generic categories built for every kind of business. You end up with a P&L that tells you how the year went in total, but not where the money came from or where it went.
Want a head start? Our post on the six numbers every pool pro should know before January covers profit per customer, where to find each number, and what to hand your CPA.
This math works best when your cost numbers are current. With Skimmer Bookkeeping, a dedicated bookkeeper keeps your books up to date in categories built for pool service, so the numbers you plug in are numbers you can trust.


